Mapping: A steppingstone to boots-on-the-ground
Conservation and development projects like the Stabilizing Land Use (PLUS) project work across landscapes to benefit both people and nature. Maps provide vital context to intervention areas, and advanced geospatial analyses can serve as steppingstones to help project planners focus their efforts on the ground.
Photo: IUCN / freepik
Conservation and development projects need to understand landscapes
It is undeniable that humans have caused significant changes to the Earth’s surface, often leaving vast stretches of land in depleted and degraded states. According to estimates reported by the Global Environment Facility, land degradation affects a staggering 3.2 billion people and counting, spanning nearly 25% of the Earth’s surface. Land degradation and human-induced land use and land cover changes are linked to global biodiversity loss, exacerbate climate change, and decrease the ability for land to support human needs. Clearly, changes are needed.
Over the past several decades, the global community has come together to address how to best halt and reverse land degradation. Global, national, and local initiatives have led to a slew of conservation and development projects focused on restoring degraded lands, reducing deforestation, providing alternative income, strengthening food systems, improving climate change resilience and more. While every project carries a unique set of stakeholders, natural conditions, and overarching goals, there is a growing consensus that effective change comes from implementing an inclusive landscape approach with data-driven decision-making. This is where geospatial analysis comes in.
Eyes on the landscape
Geospatial analysis, simply put, lets us put our eyes on the landscape. It applies satellite imagery and historical data to map and model important features of the Earth’s surface. And thankfully, there is plenty of satellite data out there to work with! A fleet of satellites equipped with specialised sensors has been orbiting our Earth for the past several decades to collect images and data about the dynamics of changes happening on the ground. Every year, more satellites are launched that allow us to see at increasingly finer scales and faster times. Today, we receive near-instantaneous coverage of the entirety of the Earth’s surface, which we can use – with the help of advanced computing tools, like Google Earth Engine – to run models and generate maps with seemingly endless possibilities.
The endless possibilities
Based on the target audience and project needs, we can pair the wealth of available geospatial data with the latest technologies to produce maps of different scopes, periods of interest, and scales.
Land use and land cover maps are fundamental geospatial analysis products that can make far-reaching contributions to conservation and development projects. Land use and land cover maps are generally produced by applying machine learning algorithms to satellite data. These maps can form the backbone of restoration projects and sustainable land use initiatives by providing a spatial context around the planned interventions. By knowing where the forests, agriculture fields, villages, and water sources are distributed throughout the landscape, we can better understand what needs to be done.
Due to the long record of satellite data, maps can be produced of not only current but also past states. In producing such maps from years and decades before and comparing them to current maps, we can create a snapshot of any landscape and understand where and how it changed. In playing back a sequence of successive maps, we can see how instances of deforestation, wildfires, or urbanisation played out over time.
In addition to mapping, the locations of different land uses and how they changed over time, we can also map out other influencing factors, from information on human population to soil characteristics, land governance, and ownership. By viewing this data spatially across a landscape of interest and combining the information with land use, conservation and restoration practitioners can prioritise interventions and assess the impacts of their projects.
But don’t forget!
While geospatial analyses have much potential and applicability to inform conservation and development, it is important to note that they cannot do it all. Geospatial analyses are not perfect, and gaps in data are expected. Creating maps takes skill, local expertise, time, and money. And, it could never replace the genuine impact from “boots on the ground” or working with local communities to create change from the ground up. But, maybe, maps can tell us where to best put our feet when we start.
How mapping applies to the PLUS project
The PLUS project works in six landscapes across four African countries – Ghana, the Democratic Republic of Congo (DRC), Uganda, and Tanzania – to enhance biodiversity in agricultural land, improve ecological connectivity, and reduce emissions from deforestation and forest degradation.
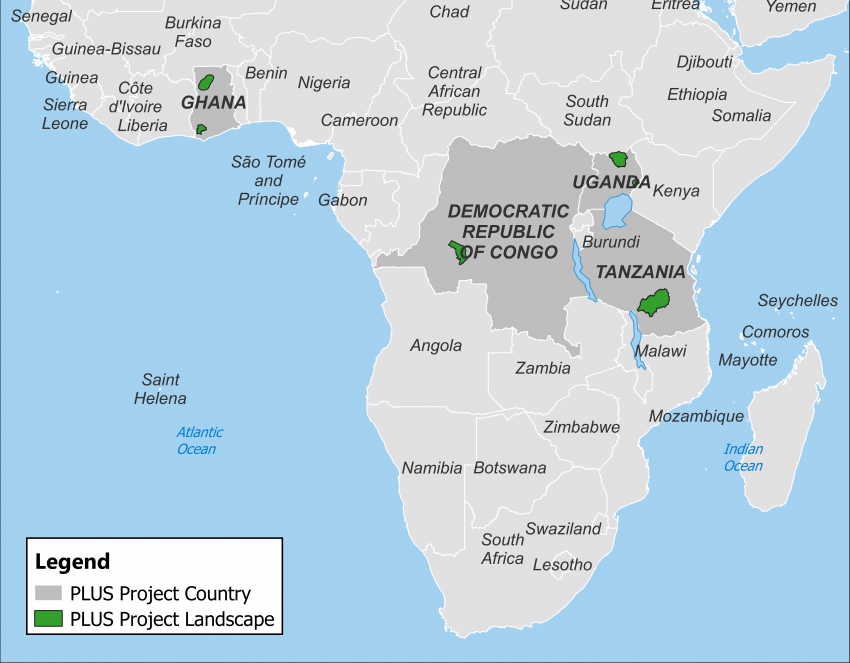 Photo: IUCN
Since 2017, the project has employed an inclusive landscape approach to engage the diverse local stakeholders in finding mutually beneficial solutions to the significant challenges throughout the landscape. These dialogues and resultant landscape management plans outline the priority actions to be taken to bring about positive change.
Landscape maps add value to the PLUS project by providing spatial context to the individual landscapes by mapping the land use interventions and quantifying changes since the project started. Overview maps like the map in Figure 1 outline exactly where conservation action is taking place and can serve as key tools when communicating the project's reach to wider audiences.
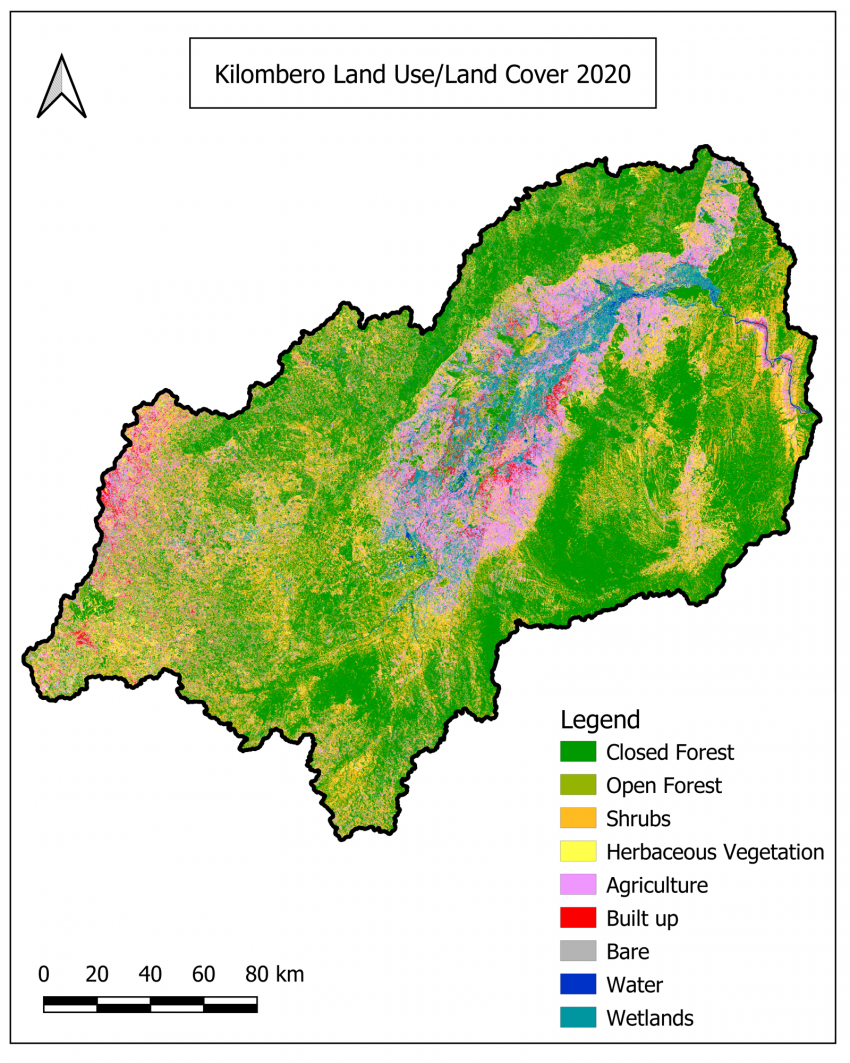 Photo: IUCN
Site-specific land use and land cover maps, such as the one shown in Figure 2 of the Kilombero landscape in Tanzania, zoom in to reveal the distribution of forests, wetlands, agriculture, built-up areas, and more. This information is crucial in planning out targeted activities on the ground. Going further, land use and land cover maps of the same site created for different periods, like the Figure 3 example of the Mangai landscape in DRC, can be created thanks to the immense archive of satellite data.
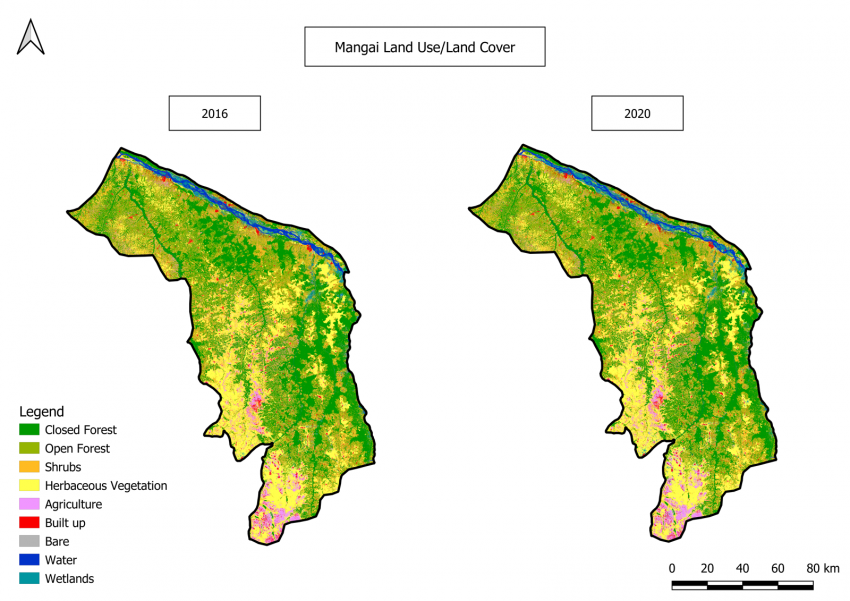 Photo: IUCN
The paired Mangai maps show little change over the project period, which can be considered a success for the project that aims to stabilise land use and reduce deforestation. Finally, in addition to viewing multiple maps of the same site from different time periods side-by-side like in Figure 3, maps can also be overlayed and their differences grouped into categories of interest to highlight important changes. In the final example of the Wassa Amenfi landscape in Figure 4, changes between maps from 2015 and 2020 were grouped to highlight conversion of natural areas (i.e., forest, grassland), shown in red.
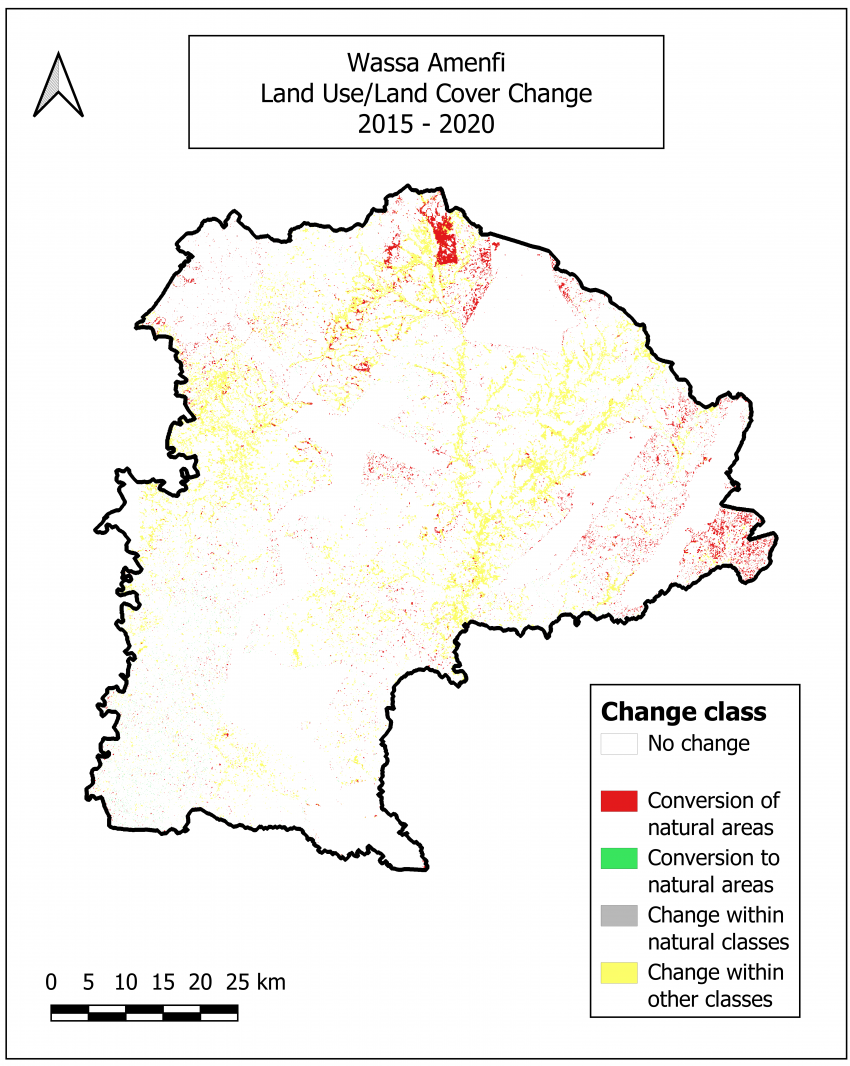 Photo: IUCN
These examples are small pieces of the endless possibilities for geospatial analyses in informing conservation and development. One thing is clear: as the consensus continues to grow on the effectiveness of the landscape approach to conservation and land management, we should not forget to highlight the crucial role that maps can play. All in all, it takes a pen (management plans), a map (geospatial analyses), and a sturdy pair of boots (implementation on the ground) to get the work done right!
—Web story by Mary Mulligan, IUCN Intern, and the IUCN Forests and Grasslands Programme
Related content
Today the European Commission proposed a new nature restoration law with binding targets on…
The BIODEV2030 project, launched in early 2020 supports the country's development ambition, while…

IUCN welcomes with relief and gratitude the negotiated decisions on fishing subsidies made…

Sign up for an IUCN newsletter